6 Best AI Graph Generator Tools in 2024: Tested

Graphs and charts are valuable tools when evaluating statistical data, comparing sets, and stressing information in a way that is easy to understand and remember.
As a content marketer, freelancer, data analyst, or just an ordinary user of informative visuals, AI-powered graph generators would be your significant solution to developing the most appealing graphs or charts in real-time.
Your curiosity about AI-powered graph generators could direct you to your favorite search engine to seek more information about their operations and superior software.
However, selecting the best AI graph generators to help produce professionally-looking charts or graphs for presentation and statistic analysis purposes could be challenging because of multiple search results.
In this product review, I will review the best AI Graph Generator tools to help you select the most significant ones to meet your chart or graph generation requirements.
What are the Best AI Graph Generator Tools?
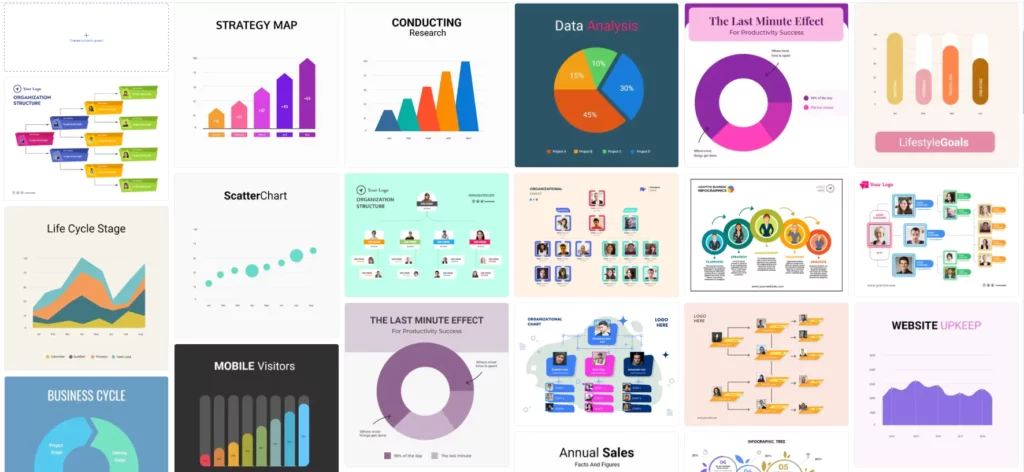
1. Appy Pie Design.
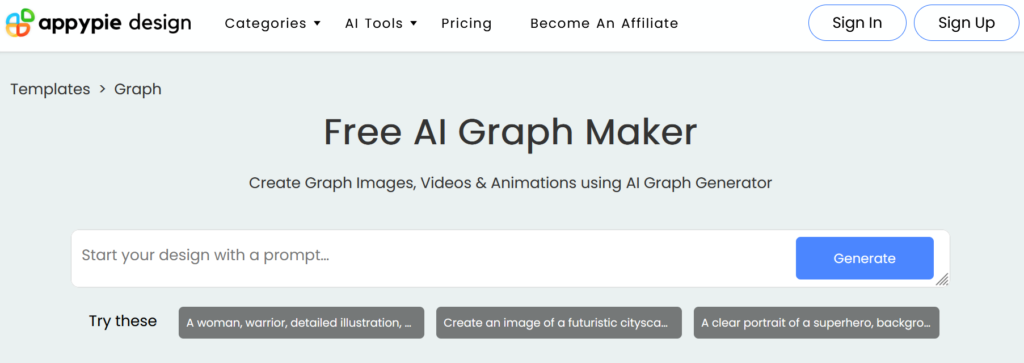
I recently discovered Appy pie design elements and instantly liked them. This AI-powered graph maker offers a wide range of chart types for business presentations, such as pie charts and line graphs.
Additionally, the software helps generate visually appealing graphs through its built-in chart templates, which allow you to change fonts and colors.
The icing on the cake when using this graph maker is the power to download your graph in various website-friendly formats like PDF or JPEG.
Key Features and Pros:
- Artificial Intelligence Powered: Appy Pie’s free AI graph maker allows you to create multiple charts to boost your data analysis and presentation.
- Multiple Graph Templates: The graph generator is a modern software with various graph templates that will kick-start the creation of the best visual presentation, even when you have a mental block.
- Real-Time: Appy Pie’s AI graph maker has an AI-powered graph-designing feature that guarantees the real-time generation of visually appealing content.
- Compatibility: Appy Pie is also compatible with your website, given that you can download your chart in multiple formats.
- Drag-and-drop Interface: The AI tool’s drag-and-drop interface will ease your graph and chart creation, even if you lack skills in generating these informative visuals.
Cons:
- Free Plan Package Limitation: The AI tool’s free online graph generator plan might require upgrading to allow you to enjoy all functionalities.
Pricing:
This AI tool offers a 7-day free trial and a 30-day money guarantee after subscription. The paid version is $8 per month.
My Verdict on Appy Pie:
Appy Pie leverages the power of artificial intelligence to generate various graph types that will improve your data analysis and presentation processes.
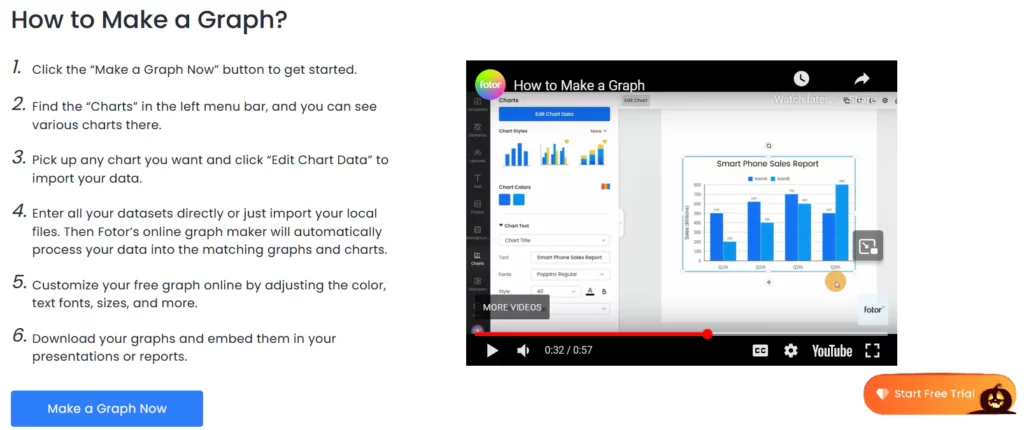
2. Fotor Online Graph Maker.
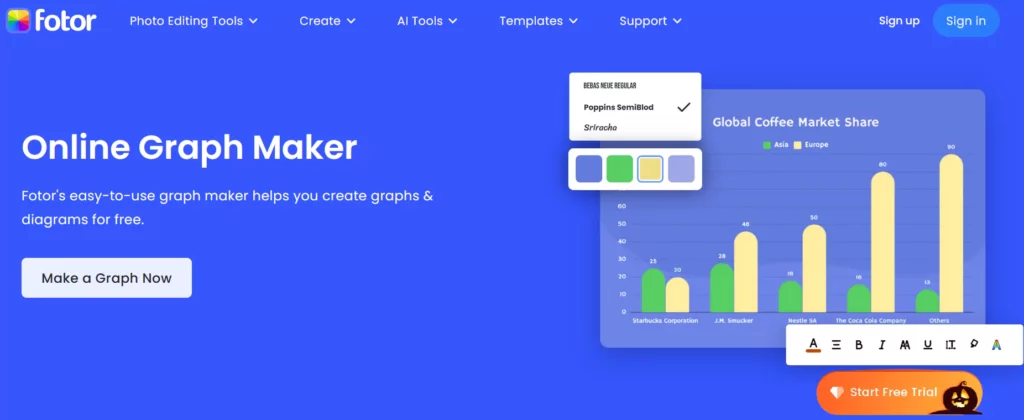
If you are looking for an online graph maker that is easy to use and has a free AI feature to help you create graphs and diagrams, you should look no further than Fotor Online Graph Maker.
What made me use this software is its exquisite built-in chart templates. In one scenario, I browsed its numerous templates, clicked the preferable template, and entered data on the pop-out window.
I also noticed that I could switch between different chart types, like line charts, bar charts, and line graphs, depending on how I wanted the final analysis to appear.
Further, Fotor online graph maker offers you a chance to import the data instead of inputting it, which takes time.
Key Features and Pros:
- Powerful and Logical Algorithms: Fotor Online features powerful and logical algorithms that enable the formulation of graphing equations that create graphs.
- Customization of Template: With Fotor Online, you can customize your chart template by changing the frame structure style, the image’s color, text font size, and more.
- Download Charts in Multiple Formats: Fotor Online lets you download the best chart or graph using PNG, JPG, and PDF formats.
- Allows Embedding in Presentations: The graph maker allows you to embed online graphs into presentations, giving the content a professional look.
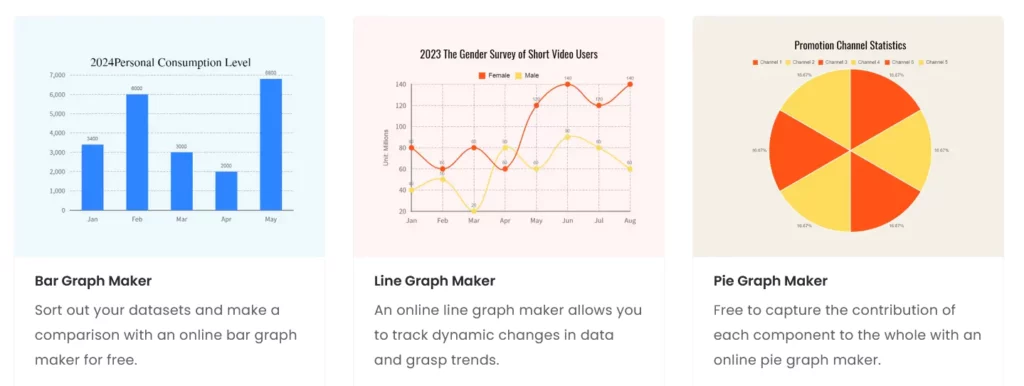
- Multiple Data Visualizations: Fotor, an online graph maker, offers multiple data visualizations through bar charts, pie charts, and line graphs.
Cons:
- Lengthy Learning Curve: The software has multiple options, so you will take time to learn it correctly.
Pricing:
You can start using Fotor Online Graph Maker, but for advanced features, try these pricing plans:
- Fotor Pro: $3.33/mo.
- Fotor Pro+: 7.49/mo.
Fotor’s Verdict:
Fotor Online’s powerful and logical algorithms will allow you to produce a wide range of graph types and improve the chart creation process.
Apart from being a graph maker, Fotor is an all-in-one AI tool as it also acts as an AI avatar, image, art, background, album generator, and more.
3. Chartblocks.

Chartblocks is an online chart-building tool that has gained the reputation of being “the world’s easiest chart builder,” as one can design and share charts in real-time.
With Chartblocks, you do not require a substantial visual design background because of its simple user interface.
Also, what you will admire the most about this powerful AI tool is its vast collection of pre-designed graph templates that allow users to customize them per their needs.
Key Features and Pros:
- Data Import Wizard: Chartblocks is an online chart software with a data import wizard that allows you to pull information from multiple files.
- Responsive Charts: This online chart builder incorporates responsive charts that allow you to operate on any device.
- Share the Final Content: Chartblocks allows you to share the final content through your website or social media platforms.
- User-friendly Interface: The graph maker provides a user-friendly interface that makes navigation and graph creation easy.
- Pre-designed Templates: You can select different chart types within its pre-designed templates.
- AI-Powered Tool: Chartblocks is an AI tool that helps users to create various charts in real time and with minimal effort.
- Chart-Building Wizard: The software has a chart-building wizard to help you select the correct information to design graphs and charts.

Cons:
- Over-enhance Graph Designs: Chartblocks over-enhances your graph designs, eliminating its primary purpose, which is to display informative data.
- Outdated PDF Formats: Despite the software creating visually appealing and informative charts, you might detest images downloaded in PDF files since they come in obsolete formats.
Pricing:
You can use Chartblocks for free.
Chartblocks Verdict:
With the AI graph generator, you can benefit from great templates, interactive charts, and precise data visualization, but its overdoing of graph designs eliminates professionally-looking content.
4. Taskade AI Knowledge Graph Generator.

Dealing with large amounts of data could be time-consuming and challenging, but using an AI-generated knowledge graph would help solve this problem.
For this reason, if you’re looking forward to a structured and organized view of statistical data and an easy way to make a graph, try out Taskade’s AI knowledge graph generator.
First, the software simplifies chart creation through its multiple built-in templates, visually attractive graphs, and customizable features.
These characteristics help the audience understand the displayed data easily.
Besides, this dynamic knowledge graph maker will help you develop an all-inclusive visualization of data without any design skills.
Moreover, Taskade integrates features that streamline workflows and identify key insights, creating real-time charts.
Key Features and Pros:
- Knowledge Graph: Taskade creates a knowledge graph to suit your needs in seconds instead of standard software that could take hours.
- Intuitive and Straightforward: Taskade is intuitive and straightforward, meaning you don’t require the technical ability to navigate the platform.
- Comprehensive and Structured: What I also loved about Taskade is the ability to produce structured, comprehensive output with an organized data view.
- Customizable Chart Templates: Taskade’s customizable chart templates enable you to create a chart or graph to suit your needs.
Cons:
- Editing Restrictions on Built-in Templates: While Taskade offers customizable templates, it restricts some changes that could make you own the final visual informative tool.
Pricing:

- Pro ($19/mo) – 5 workspaces, up to 10 users, 20 GB of storage, and 6-month project history.
- Business ($49/mo) – 20 workspaces, up to 25 users, 100 GB of storage, and 1-year project history.
- Ultimate ($99/mo) – Unlimited workspaces for your teams, clients, and organization, invite up to 50 team members, store and share files with up to 1,000 GB storage, 5-year project history, and more.
Taskade AI Knowledge Graph Maker Verdict:
Taskade is among the best AI chart generator tools available in the market that generates comprehensive and interactive visualizations, making it ideal for complex data set presentation.
5. Graphmaker.AI.
Are you looking forward to generating visually engaging charts that capture your audience during business presentations, academic research, and social media marketing? Look no further.
Graphmaker is an AI-powered tool that generates visually appealing charts to help you attain your graph design goal.
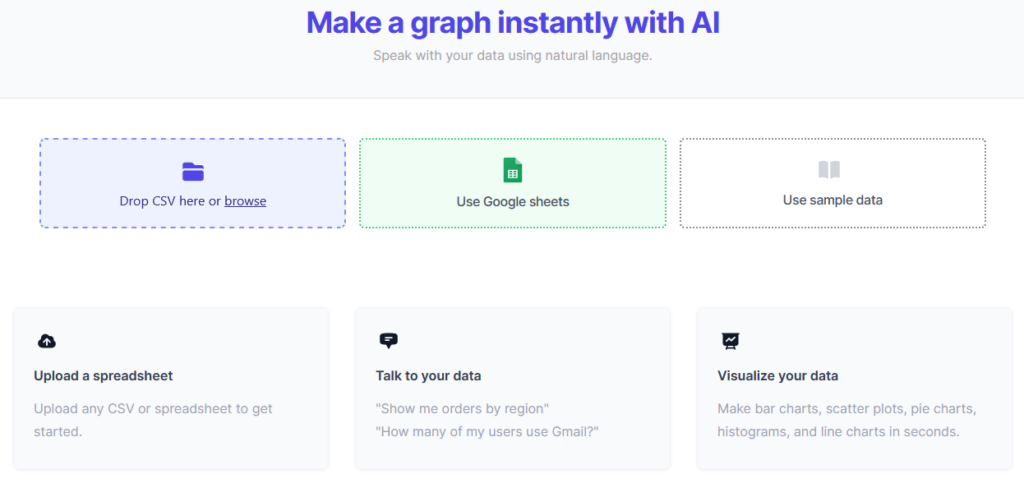
I have been using this software to create visually appealing outputs, such as pie charts, bar charts, and line graphs.
Moreover, this graph maker allows you to upload data from CVS files and Google Spreadsheets, significantly decreasing the time to input information manually.
Key Features and Pros:
- Intuitive User Interface: Graphmaker’s intuitive user interface makes it easier to design charts.
- Simplify the Process: Graphmaker’s AI capabilities simplify the graph designing process, making it easy to create visually appealing outputs.
- Create Charts using Multiple Sources: The AI-powered graph maker helps you create charts and graphs using data in CSV files, Google Sheets, and other database formats.
- Multiple Chart Templates: The graph maker provides multiple chart templates for various chart types.
- Variety of chart types: The AI graph maker is designed with multiple chart types that would allow you to produce personalized graphs.
Cons:
- The free version will limit your creation of a custom graph and diagram.
Pricing:
For $15/mo, you access unlimited chats, messages, and graph generations, and you can save your results to the dashboard.
My Verdict on Graphmaker.AI:
Graphmaker’s AI capabilities will enhance your graph creation ability, mainly when you have limited chart-designing skills.
6. Akio Chart Generator AI.

Akio Chart Generator AI has emerged as one of the best AI chart generators.
The core reason I prefer Akio Chart Generator AI is GPT-4, a powerful natural language processing element that revolutionizes graph data analysis, chart creation, and conversational experiences.
Besides, the GPT-4 trait lets you connect live with data sources, enabling real-time chart and graph creation.
Additionally, you can use Akio Chart Generator AI to predict employee attrition and sales forecasts.
When using Akio Chart, you will have the power of a graph designer to transform your data into a wide variety of graph types.
Key Features and Pros:
- Machine Learning Model: Akio Chart Generator AI has a machine learning model that boosts smarter decisions with a few clicks.
- Predictive Tool: The AI-powered graph creation software has a predictive tool that will utilize your existing data to forecast business outcomes.
- Live Charts and Reports: Akio Chart Generator AI utilizes your information to generate live charts and reports that change with data updates.
- Easy to Share: The AI tool allows you to share your graphs with team members instantly through a link.
- Pre-installed Templates: The AI-based graph maker facilitates the creation of a wide variety of chart types like pie and bar visuals.
Cons:
- Editing Issues: While Akio automates the graph generation process, it may be rigid regarding customization.
- Dependent on Input Data: Akio heavily relies on the quality and structure of the data provided by the graph creator to produce the best output.
Pricing:
- Starter ($49/mo) – 1 user, Up to 1M rows of data, u to 10K actions/mo, and more.
- Professional ($499/mo) – 5 users, up to 10M rows of data, up to 1M actions, and more.
- Business ($1,499/mo) – 10 users, up to 100M rows of data, up to 25M actions monthly, and more.
- Enterprise (Custom Quote) – Unlimited users, unlimited data, and unlimited actions.
My Verdict on Akio Chart Generator AI:
Akio specializes in transforming data into visual representations and creating charts. However, you will own the final chart or graph partially because these built-in sheets have editing limitations.
What are AI Graph Generator Tools?
Before the emergence of AI chart generators, producing graphs and charts for business and educational presentations remained a tedious and unproductive task, given that individuals required additional skills and time to create these informative visuals.
However, by integrating AI graph generators, individuals are now attaining their goals of professionally done charts.
AI graph generators automate the charts or graph creation process; they are user-friendly, and you will require no technical design skills to operate a majority of these AI tools; thus, they harness the power of AI.
Additionally, these chart-designing tools eliminate problems encountered during chart creation when using standard graph-maker tools. Furthermore, the selection of graph and chart templates makes these visual makers helpful during the design process.
How do Chart Creators Operate?
These AI-powered graph makers use algorithms to analyze data and create visually appealing graphs. The basic steps when using these AI tools are:
(1) Choose a template from the vast collection of pre-designed graphs.
(2) Start customizing your graphs.
(3) Download your graph in various formats depending on the selected software.
FAQs
What are the benefits of using AI Chart Makers?
Core benefits you will generate because of these AI-powered chart and graph tools include efficiency, accuracy, editing, ease of use, and various customizable graph templates.
What are the limitations of using chart generators to create a wide selection of graph types?
AIgraph makers present risks such as data privacy violation, complexity, limited customization, and high purchasing costs.